Running Head: Census Tract Variability in COPD Acute Care Use
Funding Support: None
Date of Acceptance: December 11, 2025 | Published Online Date: December 15, 2025
Abbreviations: ACS=American Community Survey; AECOPD=acute exacerbation of COPD; CAR=conditional autoregressive; CI=confidence interval; COPD=chronic obstructive pulmonary disease; ED=emergency department; ICD-10=International Classification of Diseases, Tenth revision; IRR=incidence rate ratio; IQR=interquartile range; PBIR=population-based incidence rate; SES=socioeconomic status; SNAP=Supplemental Nutrition Assistance Program; THCIC=Texas Health Care Information Collection
Citation: Parekh TM, Dunphy P, Hall EM, et al. Census tract variability in COPD emergency department, hospitalization, and readmission rates in Travis County, Texas. Chronic Obstr Pulm Dis. 2026; 13(1): 39-48. doi: http://doi.org/10.15326/jcopdf.2025.0663
Online Supplemental Material: Read Online Supplemental Material (546KB)
Introduction
The disease trajectory of chronic obstructive pulmonary disease (COPD) is altered by acute care events for COPD exacerbations. Severe exacerbations, including emergency department (ED) visits, hospitalizations, and readmissions, account for nearly 30% of total COPD expenses, which are projected to reach $60.5 billion in 2029 in the United States.1,2 With the enactment of the Hospital Readmissions Reduction Program, hospital payments are tied to 30-day readmission rates, and institutions that perform poorly compared to peers can incur financial consequences.3 To reduce COPD morbidity risk, minimize health care costs, and avoid institutional financial penalties, it is crucial to understand individual and neighborhood risk factors for ED visits, hospitalizations, and readmissions. A clear understanding can aid the design of effective multilevel interventions that range from health-promoting programs to changes in public policy that support lung health. While prior literature has focused on individual-level risk factors for severe exacerbations, there is growing evidence that ties community-level social and environmental determinants to the individual’s risk of exacerbations.
Neighborhood characteristics, such as neighborhood poverty and racial residential segregation, have been associated with increased risk for COPD exacerbations.4,5 Similar findings have been shown in asthma, where moving from a high to low poverty neighborhood is associated with a reduction in asthma exacerbation frequency.6 Understanding the COPD acute care use risk of a population from a certain geographic area is important for planning and allocating resources for community and policy level interventions centered on the geographic area of interest.7 A 2006 study characterized COPD hospitalizations across Texas counties and found variations in hospitalizations by sex, race, and the metropolitan versus nonmetropolitan status of counties.8 However, the use of county-level data, as opposed to census tract data, in that study precludes access to granular details that may explain variation in acute care use rates. Census tracts are small, relatively permanent subdivisions of a county whose boundaries remain constant throughout each decade. They have an average population of approximately 4000 people and are tied to a rich set of demographic and economic data available for population-based research.9
In this study, we described the spatial distribution of COPD-related ED visits, hospitalizations, and 30-day readmissions across census tracts in Travis County, Texas, between 2016–2020. To understand the role that neighborhood characteristics, including demographic, socioeconomic, and built environmental characteristics, at the census tract-level play in COPD outcomes in Travis County, we estimated associations between census tract-level neighborhood characteristics and census tract-level COPD-related ED visits, hospitalizations, and 30-day readmissions rates.
Methods
Study Design
This is an observational, ecological study investigating the spatial distribution of acute exacerbations of COPD (AECOPDs) resulting in an ED visit without a hospitalization, a hospitalization (either through the ED or otherwise), or a within 30-day readmission for an acute exacerbation, across census tracts in adults 40 years and older who lived in and received care in Travis County, Texas, between 2016–2020. The Texas Health Care Information Collection (THCIC) dataset10 provided COPD-related ED visit and hospitalization events linked over time to specific but deidentified individuals, from which we computed counts (based on International Classification of Diseases, Tenth revision [ICD-10] diagnostic codes) from all hospitals in Travis County from 2016 through 2020. We used the U.S. Census Bureau’s 2019 American Community Survey (ACS) for data on the population to serve as denominators for calculating population-based incidence rates (PBIRs).11
Measurements
We measured PBIRs of AECOPD ED visits without a hospitalization, PBIRs of AECOPDs resulting in a hospital admission, and 30-day re-admission rates for AECOPDs. AECOPDs were defined by an ICD-10 COPD exacerbation diagnosis code or a principal diagnosis of acute respiratory failure with a secondary COPD diagnosis code (Appendix A in the online supplement).12,13 Tract-level demographic, socioeconomic, and built neighborhood characteristics were drawn from the 2019 ACS.11 Demographic, socioeconomic, and built environment were chosen a priori based on prior literature implicating these characteristics in respiratory morbidity burden.14,15 We did not include any individual demographic data, including individual race or ethnicity. We also did not include any composite measures of vulnerability, including the Area Deprivation Index or the Social Vulnerability Index. This was intentional as specific characteristics, such as housing age, crowding, or food insecurity, allows for the identification of actionable targets for intervention that can help tailor community level policies and programs more precisely than composite scores.
Statistical Analysis
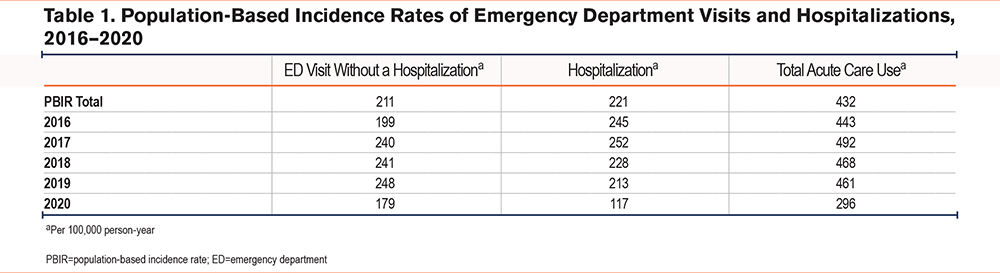
PBIRs for ED visits without hospitalizations, hospitalizations, and total acute care use (ED visits without a hospitalization plus with hospitalizations) were calculated at the census tract-level for individual years and across the 5-year timespan (2016–2020) in adults 40 years old and older. The numerator was the total number of AECOPD visits (ED without a hospitalization, with hospitalization, or total acute care use) in adults over 40 years old in Travis County census tracts and was obtained from the THCIC dataset. The denominator was the census tract population of adults over 40 years old and was obtained from the ACS dataset. The PBIR was calculated by dividing the numerator by the denominator and then multiplying by 100,000 to obtain PBIR per 100,000 person years.
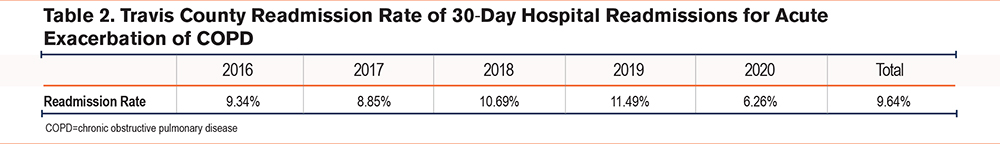
A 30-day readmission for AECOPD was defined as 2 hospitalizations for AECOPDs occurring within a period of <30 days from discharge of the first hospitalization to admission date of the second hospitalization. Readmission rates were calculated by dividing AECOPD readmissions by the total number of hospitalizations for AECOPDs that occurred between January 2016–November 2020. Hospitalizations that resulted in death of the individual were not included in the total count of hospitalizations for the denominator in the calculation of readmission rates.
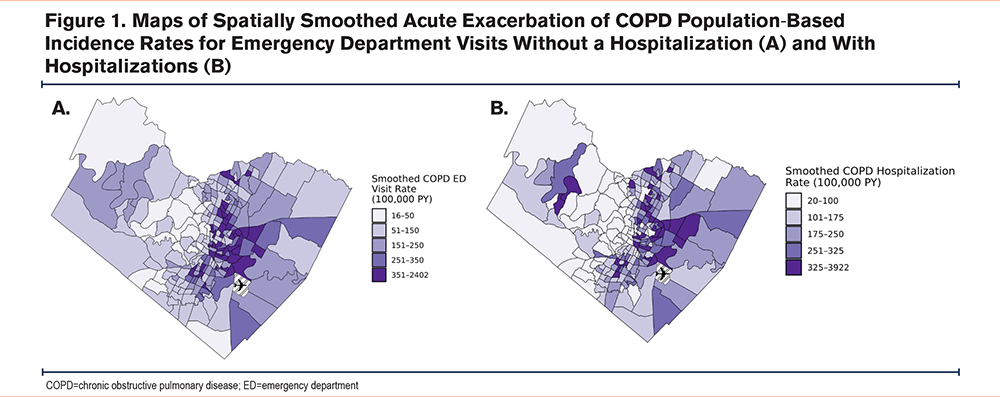
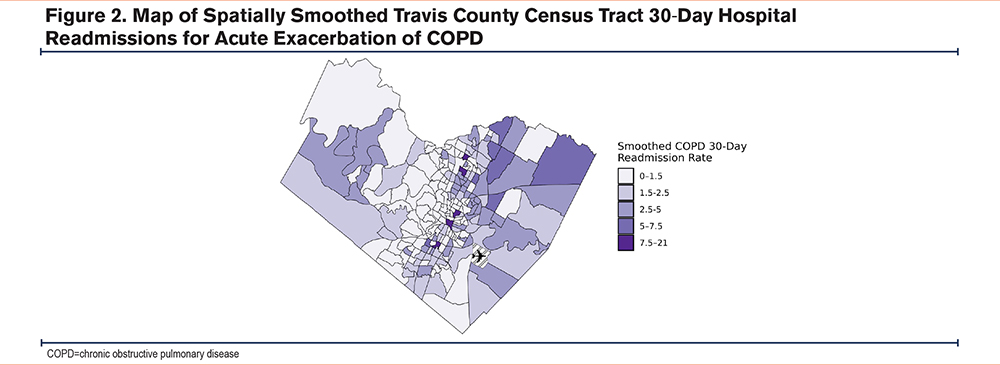
We created thematic maps of estimated census tract-level PBIRs for ED visits, hospitalizations, total acute care use (ED visits and hospitalizations), and readmission rates first based on the raw PBIR estimates (Supplemental Figures 1 and 2 in the online supplement), and then using conditional autoregressive (CAR) spatial incidence models calculated with the CARBayes package in R studio.16,17 The CAR models estimate a smoother PBIR response surface by borrowing information for a given tract from its neighbors based on the correlation among tracts, and by shrinking PBIRs toward the overall mean, with greater shrinkage for less informative tracts (i.e., most commonly those with smaller population denominators).
Descriptive statistics were used to describe demographic, socioeconomic, and built environment characteristics of census tracts in Travis County. Using census tract as the unit of analysis, CAR models were also used to estimate associations of PBIRs of ED visits, PBIRs of hospital admissions, and 30-day readmission rates to each demographic, socioeconomic, and built-environment characteristic. The Hochberg procedure was used to correct for multiple testing of nonunity incidence rate ratios within groups of predictor characteristics for each outcome.18
Tau and rho parameters generated by the CARBayes models were used to help interpret statistically significant associations of COPD outcomes to census tract characteristics. The tau parameter captures the variance of census tract-level COPD acute care use incidence rates (net of Poisson measurement error) that is unexplained by the predictors in the model. The rho parameter is an estimate of the degree of autocorrelation of COPD acute care use incidence rates (net of independent Poisson measurement error) among neighboring census tracts, with higher rho values indicating greater spatial correlation (range 0–1 with 1 indicating perfect correlation), meaning observations in neighboring areas are more similar. Inclusion of strong predictors in the model will, therefore, tend to drive down the variance parameter (tau), and, if those predictors are spatially autocorrelated themselves, will drive down the autocorrelation (rho) as well.
Results
Across a span of 5 years (2016–2020), there were 4802 ED visits without a hospitalization and 4794 hospital admissions for AECOPDs recorded in the THCIC dataset in adults > 40 years of age in Travis County. PBIRs across tracts aggregated over 5 years for COPD-related ED visits and hospital admissions among Travis County census tracts were highly variable (ED visits: median 168 visits per 100,000 person year, [interquartile range (IQR) 71–296]; hospitalizations: median 179 visits per 100,000 person year [IQR 90–297]; total acute care use: median 355 visits per 100,000 person year [IQR 168–596]) (Table 1 and Supplemental Table 1 in the online supplement). The number of readmissions between January 2016 and November 2020 totaled 444. Yearly readmission rates aggregated across tracts ranged from 9%–12% until 2020 when they dropped to 6%; this coincided with the COVID-19 pandemic (Table 2). The median readmission rate across tracts over 5 years was 6.25% (IQR 0%–11.4%). Sixty-four index hospitalizations resulted in death and were not included in the calculation for readmission rates. Of the index hospitalizations used in calculation for readmission rates, 64% were discharged home, 16% were discharged home with home health services, and 10% were discharged to a skilled nursing facility while the remaining 10% were discharged to miscellaneous locations including inpatient rehab, long term acute care centers, or psychiatric hospitals.
PBIRs estimated from CAR modeling for ED visits, hospitalizations, acute care use, and readmission rates across census tracts are mapped in Figures 1 and 2. We observed a spatial pattern among census tracts for ED visits and hospitalizations, with higher incidence rates in Eastern Travis County census tracts. The census tract incidence rates for ED visits and hospitalizations are correlated with those of surrounding census tracts (rho: 0.76 for ED visits and 0.53 for hospitalizations) indicating similarity among neighboring census tracts (Supplemental Table 3 in the online supplement). There was a tendency for the census tracts with the highest PBIRs to be concentrated in areas with a higher percentage of non-White and low-income residents (Supplemental Figure 1 in the online supplement). We did not observe a clear spatial pattern in readmission rates; consistent with this observation is that census tract readmission rates were only weakly correlated with rates of surrounding census tracts (rho: 0.23).
Overall, census tract demographic, socioeconomic, and some built environment characteristics were associated with both ED visit and hospitalization PBIRs, but not with readmission rates except for vacant housing (Table 3). Specifically, associations between the percentage of the census tract population that is Black and the percentage that is Latinx/Hispanic and ED visit and hospitalization rates were statistically significant. These census tract characteristics were not associated with readmission rates (incidence rate ratio [IRR] [95% confidence interval (CI)]: 1.00 [0.87, 1.15] and 1.02 [0.97, 1.08], respectively). Associations between the percentage of the population that speaks no English and ED visits and hospitalizations were statistically significant. This census tract characteristic was not statistically significantly associated with readmission rates, although the IRR was 1.14 and the 95% credible interval wide (0.87–1.53). Racial and ethnic composition of census tracts explained some of the variance in both ED visit and hospitalization rates across census tracts (Tau2, a measure of variance, decreased by 40%–50% with the inclusion of these variables) and also accounted for the spatial autocorrelation of both outcomes (rho decreased by >50%) (Supplemental Table 3 in the online supplement).
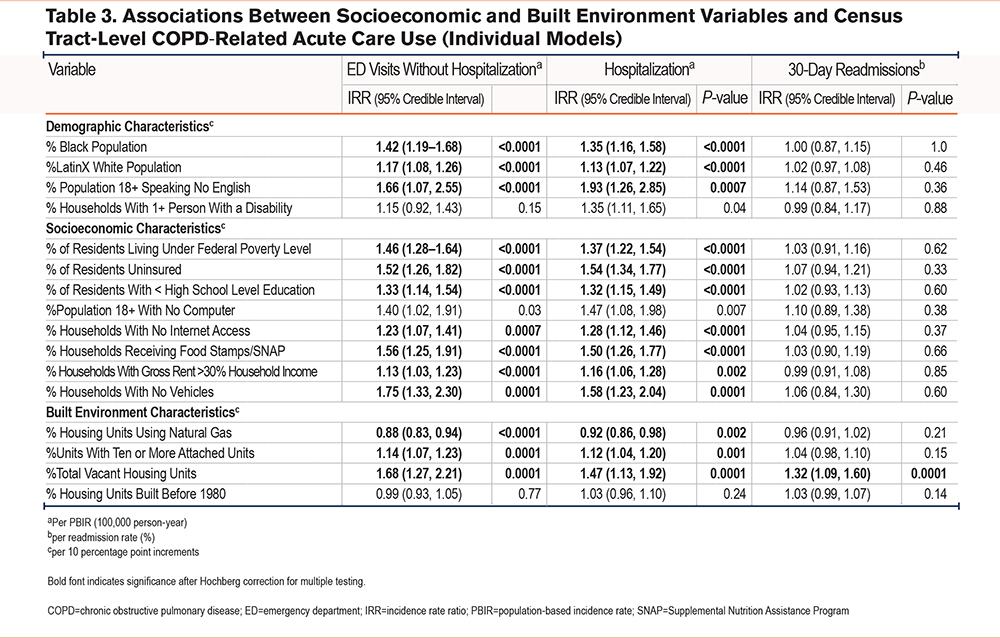
For socioeconomic factors, multiple measures of census tract-level poverty were positively associated with ED and hospitalization rates, including percentage of residents living below the federal poverty line, percentage of uninsured residents, percentage of residents with less than a high school education, percentage of households with no internet access, percentage of households with rent >30% of income, percentage of households receiving Supplemental Nutrition Assistance Program (SNAP) food assistance, and percentage of households with no vehicle. For ED visits and hospitalizations, poverty, uninsured rates, and receipt of SNAP benefits (plus no internet for hospitalizations) reduced the variance and spatial correlation compared with the null model, but other socioeconomic status (SES) factors did not. For readmissions, there were no statistically significant associations with SES factors and for most SES factors, IRRs ranged from 0.99–1.04. Associations with some SES factors were stronger, but with wider credible intervals (e.g., percentage of population with no computer, IRR 1.10 [0.89, 1.38]). Inclusion of SES factors did not change the variance or spatial correlation compared with the null model.
Some built environment characteristics were associated with ED and hospitalization rates (percentage of housing with natural gas, percentage of units with 10 or more attached units [multifamily housing], and percentage of vacant housing units). Whereas multifamily housing and vacant housing were positively associated with ED and hospitalization rates, the percentage of housing with natural gas was inversely associated with ED visits and hospitalizations. For ED visits and hospitalizations, inclusion of the built environment characteristics did not affect the spatial correlation and had only a small effect on the variance. Of all the neighborhood characteristics measured, only vacant housing was statistically significantly associated with readmission rates after Hochberg correction for multiple testing. Inclusion of vacant housing decreased the variance and increased the spatial correlation compared to the null model. Associations with other built-environment characteristics were less strong and not statistically significant; percentage of housing units with 10 or more attached units and percentage of units built before 1980 were positively associated with readmission rates (IRR [95% CI]: 1.04 [0.98, 1.10] and 1.03 [0.99, 1.07], respectively).
Discussion
In this study, census tract-level COPD ED visit and hospitalization rates exhibited spatial patterning with higher rates in Eastern Travis County and were associated with some census tract characteristics. In contrast, census tract-level COPD readmission rates did not exhibit a clear spatial pattern and tended not to be associated with census tract characteristics outside of vacant housing. Together, these observations suggest that: (1) contextual factors related to neighborhoods may play a role in initial COPD-related acute health care use but less so in readmission rates, and (2) other factors may be more important determinants of census tract-level readmission rates.
Consistent with our findings, other studies have found that COPD exacerbation risk varies geographically19; however, these studies have examined geography at much larger spatial scales, which contrasts with our study that examined COPD exacerbation rates at small spatial scales (i.e., census tracts). In addition to examining population-based COPD acute care use rates at a finer geographic scale, we also examined associations between census tract characteristics and census tract-level acute care use rates. We found that several neighborhood-level SES measures were associated with severe exacerbation rates. Several mechanisms may explain these relationships to an increased risk of severe exacerbation. Barriers to accessing health care facilities, lack of available nutrient dense food options in the area promoting inflammation and weight gain, and inability to attend pulmonary rehab due to distance may all play a role in increasing exacerbation risk.20-23 We also found that crowding and vacant housing were associated with acute care use. This may be explained by poor ventilation, an increase in some indoor allergens, neighborhood crime, poor walkability, social isolation, and lack of greenspaces, which have been tied to respiratory symptoms and exacerbations.24-27 Other studies have examined associations between neighborhood characteristics and individual level risk of COPD exacerbations among those with COPD, rather than neighborhood-level rates of COPD exacerbations. Galiatsatos et al performed a secondary analysis of the Subpopulations and Intermediate Outcome Measures in COPD study and found that individuals residing in the most disadvantaged neighborhoods, determined by the area deprivation index of census block groups, were found to have a 98% increased risk of severe exacerbation.4 These results support our study’s findings in that there is a relationship between neighborhood social disadvantage and acute care use for COPD exacerbations, however, it focuses on an individual’s risk for exacerbation which is distinct from a neighborhood’s rate of exacerbation. This distinction is important as mitigating an individual’s increased risk of exacerbation based on their residential address would require a tailored approach to that individual’s social needs; however, reducing a neighborhood’s acute care use rate for COPD exacerbations would require interventions at the policy and community levels that could involve enforcing stricter emission standards for nearby industrial plants, enacting public health campaigns to increase vaccination rates, or allocated government funds for food and housing assistance based on tract level poverty rates.28 Neither approach to understanding risk and targeting risk reduction is independently sufficient to definitively determine appropriate policies, however, both individual and population-based studies such as ours can be used to motivate and inform policy.
For readmissions, the spatial pattern is less clear and there were minimal associations with neighborhood characteristics compared with ED visits and index admissions. Individuals’ risk factors for readmission for a COPD exacerbation include male sex, prior hospitalization, number of comorbidities, living in a deprived area, uninsured status, and clinical care characteristics including hospital length of stay and discharge with home oxygen, among others.29-32 In contrast, we are not aware of any U.S.-based studies that examined neighborhood, rather than individual-level, COPD specific 30-day readmissions. Nonetheless, the results in our study were contrary to our hypothesis that readmissions would exhibit spatial patterning, similarly to index hospitalizations. There are several plausible mechanisms to explain this finding. First, the number of readmission events across the 5 years, which included the decline during 2020, may not have been high enough to detect a spatial pattern. Second, our calculations for readmission rates did not account for discharges to other health care facilities such as skilled nursing facilities or long-term acute care centers, which could impact a census tract’s number of 30-day readmissions. For example, census tracts may have a high rate of index hospitalizations and a high percentage of discharges to facilities with continued care, but a low readmission rates. Our calculated readmission rate results may be biased in that our denominator for index hospitalizations included a percentage of individuals who were receiving continued care and possibly less likely to have a readmission. Third, there may be regional spatial patterning and regional factors that influence readmission rates, as opposed to local, that were not tested as the current study examined census tracts from a single county. Fourth, a lack of geographical variation may also be explained by a relatively homogenous approach from Travis County hospitals to manage COPD hospitalization discharges in a concerted effort to avoid readmissions under the Hospital Penalties Readmission Program. Such “discharge bundles” have been shown to reduce readmissions and generally consist of evidence-based practices including ensuring continuity of care, assisting with smoking cessation, providing inhaler assistance, and referring to pulmonary rehabilitation.33 Under the lens of our study’s limitations, we did not find a spatial pattern for readmission in Travis County. Interestingly, vacant housing was the only neighborhood characteristic in our study that was associated with readmission rates. Vacant housing, which can be seen as a proxy for neighborhood disinvestment, can indirectly contribute to poor health outcomes through broader social determinants of health, including social isolation, which is well documented in the literature as having a detrimental effect on health outcomes.34,35 Overcrowding, which can accompany vacant housing in certain contexts such as lower SES urban environments, was not significantly associated with readmission rates in our analysis; however, the presence of a significant association may have been absent due to lack of power. Future analyses could address the limitations associated with the readmissions analyses by expanding the sample size by incorporating a longer study duration and/or combining data across statewide or other (e.g. Medicare, Veterans Health Administration, National Inpatient Sample) datasets, and, when feasible, accounting for discharges to skilled nursing or long-term acute care facilities.
The results of our study showing an association between a higher percentage Black and Latinx population in a census tract and higher ED visit and hospitalization rates for AECOPDs suggest that there may be racial and ethnic disparities in COPD. Although there is little available evidence to support racial and ethnic disparities in AECOPDs, there is strong evidence for socioeconomic disparities in COPD, including a systematic review which found that in a majority of studies low SES confers a 2-fold increased risk of poor outcomes in COPD.36 An observational study in current or former smokers (with or without COPD) found that individual level SES explained 12%–35% of racial disparities in respiratory outcomes while neighborhood level SES explained an additional 26%–54% of disparities; when combined, individual and neighborhood level SES can explain up to 69% of racial disparities. The study was limited by its cross-section design, inclusion of only 529 Black individuals compared to 2120 White, and exclusion of those who reported mixed/other race or who did not report race.37 Our study is limited in that it did not account for the extent that neighborhood SES may explain the observed associations between neighborhood racial and ethnic composition and acute care use. Whether there are neighborhood level racial and/or ethnic disparities in COPD acute care use independent of neighborhood SES is unclear.
Our study highlights the role of neighborhood level factors on a census tract’s risk for COPD-related acute care use. By merging publicly available data such as the THCIC and ACS, our study allowed for a robust visualization of COPD morbidity trends over space that can provide a framework for future studies to determine which neighborhood level factors contribute to an increased risk of exacerbations. Our study is also a proof of concept that intracounty variation of acute care use for COPD exacerbations exists on small spatial scales and should be examined in other counties as well to inform allocation of public health resources and program planning. However, results of our study should be viewed considering several limitations. First, as this study is an ecologic study that explored the relationship between census tract characteristics and COPD-related acute care use among the population residing in that census tract, our results should be interpreted at the neighborhood, rather than individual, level. Second, our study did not include additional environmental factors that are known to be important in respiratory morbidity including exposure to air pollution, proximity to highways or industrial plants, distance from health care facilities, or urban stress.6,38,39 Third, the source of acute care use data was administrative health records which depends on accurate diagnosis and coding and timely transmission of records from hospitals to the Texas Department of State Health Services. Also, for all studies, the choice of ICD-10 codes for COPD exacerbations can over or underestimate true COPD acute care rates. Fourth, whereas our study yielded a considerable number of ED and hospitalization events (approximately 4800), there were only 400 readmission events; as such, our power to detect associations with readmission is limited. Fifth, our study included 2020, which overlaps with the start of the COVID-19 pandemic. While we aggregated data over 5 years to minimize the effects of transient fluctuations, there is a possibility that the underutilization of health care services by patients living with COPD, as seen in our yearly data, impacted our results. Further, changes in population characteristics over time may affect the generalizability of the results to present day. Finally, our study did not account for age or prevalence of smoking in census tracts which may have influenced a census tract’s acute care use rates.
In summary, ED visits and hospitalizations for AECOPDs exhibit clear spatial patterns, some of which were explained by neighborhood socioeconomic, demographic, and built characteristics. Readmission rates did not exhibit clear spatial patterns and, except for vacant housing, did not have any strong statistical associations with census tract characteristics, suggesting that neighborhood factors may be less important for readmissions.
Acknowledgements
Author contributions: TMP, PD, PR, EH, RZ, MD, and EM contributed to the conception and/or design of the study. TMP, PD, EH, and RZ acquired the data. TMP, PD, PR, MD, SC, MD, and EM were responsible for data analysis and/or interpretation. TMP, PD, EH, SC, RZ, MD, PR, and EM wrote the article and had substantial involvement in its revision prior to submission. All authors significantly contributed to the intellectual content of the article and gave final approval of this manuscript to be published.
Other acknowledgements: We dedicate this work to the memory of Dr. Paul Rathouz, whose mentorship, generosity, and scientific rigor were foundational to this project. His insight and dedication to biostatistics profoundly shaped this study and the careers of several early career investigators.
Declaration of Interest
TMP is supported by the National Heart, Lung, and Blood Institute (K23HL153672). MTD has received consulting fees from Aer Therapeutics, Aprea, AstraZeneca, Genentech, GSK, Novartis, Pulmonx, and Teva; received royalties from UptoDate; received travel support from GSK; and received research support from the Department of Defense, the American Lung Association, and the National Institutes of Health.
PD, EH, SC, RZ, PR, and EM have no disclosures.